Services
OGC WCS API
In this section, you will see how to use WCS to download raw or POF-ML stylised data
Fell free to explore the jupyter notebook use example of the WCS API.
Creating the base url
To use the power of the VtWeb framework with WCS, we first need to create our base url.
First, i need to setup the tile we want to display by defining the MODULEID, DATASETID, GRANULEID and the POF-ML STYLE we want to use.
MODULEID=VtSentinelCsarDhus&DATASETID=Sentinel1A/CSAR/IW&GRANULEID=S1A_IW_GRDH_1SDV_20210619T184231_20210619T184256_038413_048869_772B&STYLE=sar(pp(s1cal(s1nc(band(QT_vv)),g0)),rasterCrsOrtho,cdem30,egm2008)Then, we need to convert it in base64 to create an urlToken, the python code for that is :
urlToken = base64.b64encode(parameters.encode('utf-8')).decode(('utf-8'))As our urlToken is ready, we can combine it with the following WCS base url :
https://visioterra.org/VtWeb/servlet/wcs/The WCS url is now ready, we just have to adapt it to use it with with compatible services
https://visioterra.org/VtWeb/servlet/wcs/TU9EVUxFSUQ9VnRTZW50aW5lbENzYXJEaHVzJkRBVEFTRVRJRD1TZW50aW5lbDFBL0NTQVIvSVcmR1JBTlVMRUlEPVMxQV9JV19HUkRIXzFTRFZfMjAyMTA2MTlUMTg0MjMxXzIwMjEwNjE5VDE4NDI1Nl8wMzg0MTNfMDQ4ODY5Xzc3MkImU1RZTEU9c2FyKHBwKHMxY2FsKHMxbmMoYmFuZChRVF92dikpLGcwKSkscmFzdGVyQ3JzT3J0aG8sY2RlbTMwLGVnbTIwMDgpWCS : Downloading calibrated product (DB)
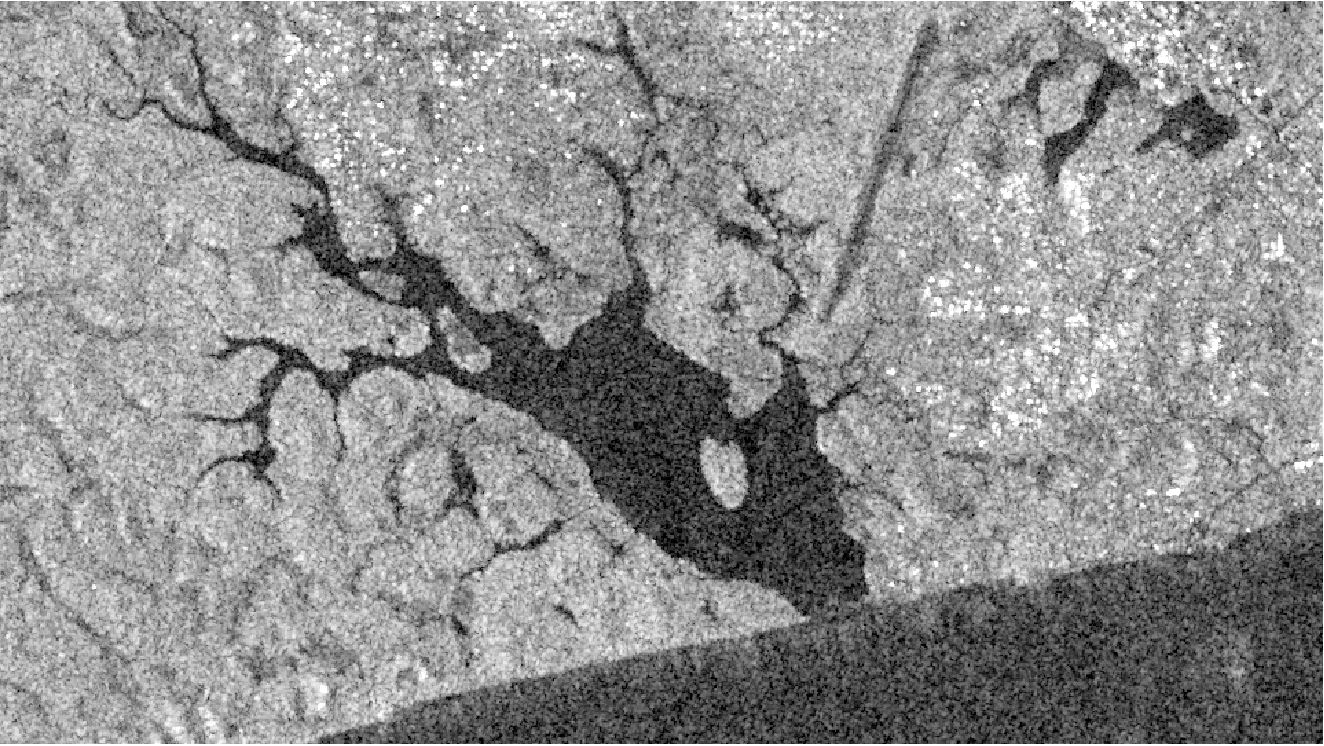
Down here is an use example of the WCS API, allowing us to download callibrated data leaflet.
We will add the following parameters to the base url we made here in order to download the data:
?SERVICE=WCS&VERSION=2.0.1&REQUEST=GetCoverage&COVERAGEID=coverageId&SUBSET=Lat(4.7107890594482,4.7569230545044)&SUBSET=Long(-6.715434741211,-6.6330372802735)&FORMAT=image/tifftheses parameters added, our final url look like this :
https://visioterra.org/VtWeb/servlet/wcs/TU9EVUxFSUQ9VnRTZW50aW5lbENzYXJEaHVzJkRBVEFTRVRJRD1TZW50aW5lbDFBL0NTQVIvSVcmR1JBTlVMRUlEPVMxQV9JV19HUkRIXzFTRFZfMjAyMTA2MTlUMTg0MjMxXzIwMjEwNjE5VDE4NDI1Nl8wMzg0MTNfMDQ4ODY5Xzc3MkImU1RZTEU9c2FyKHBwKHMxY2FsKHMxbmMoYmFuZChRVF92dikpLGcwKSkscmFzdGVyQ3JzT3J0aG8sY2RlbTMwLGVnbTIwMDgp?SERVICE=WCS&VERSION=2.0.1&REQUEST=GetCoverage&COVERAGEID=coverageId&SUBSET=Lat(4.7107890594482,4.7569230545044)&SUBSET=Long(-6.715434741211,-6.6330372802735)&FORMAT=image/tiffThe output of this request, stretched for visualisation purpose, is :
WCS : Downloading POF-ML stylised data
Construction of the request
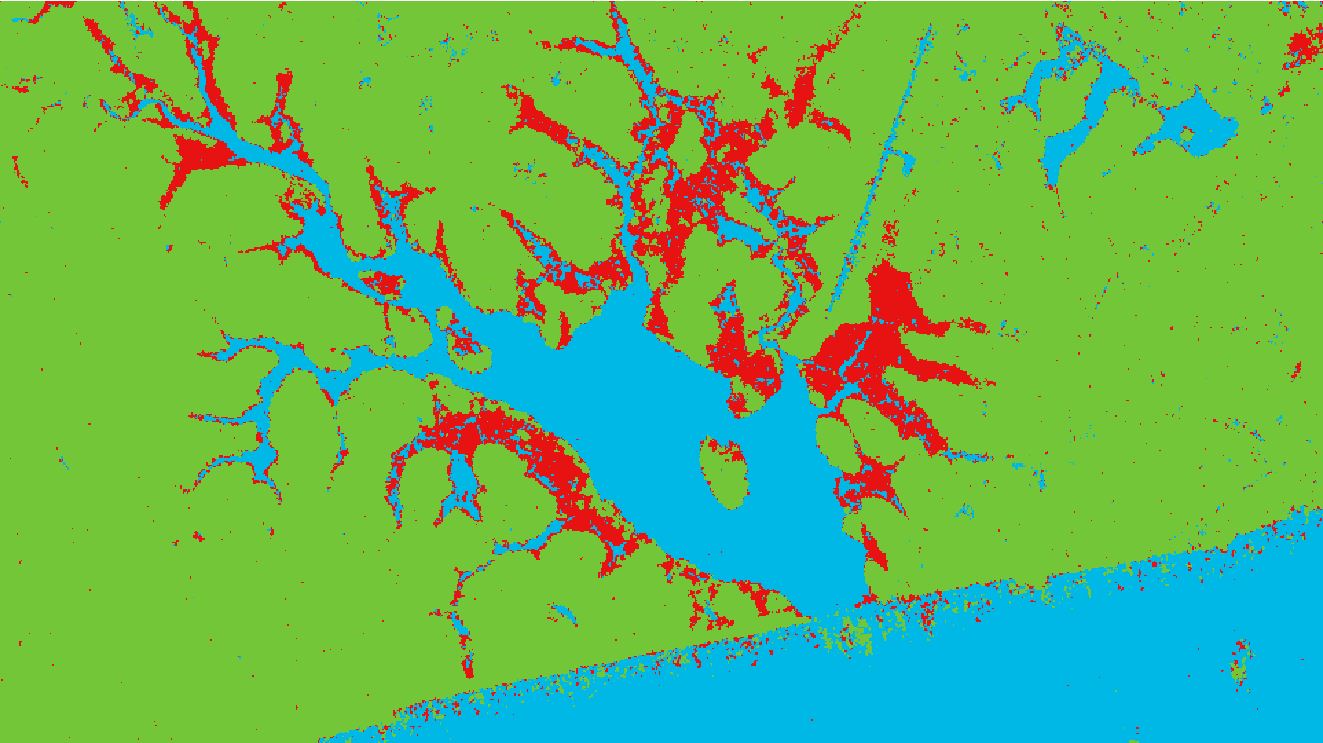
Here is an example of request to download a flooding indicator. San pedro has suffered major floodings between 2021/06/19 and 2021/07/01. So let compare the two dates :
https://visioterra.org/VtWeb/servlet/wcs/JkdSQU5VTEVTPVsgICB7ICAgICAgIm1pZCI6IlZ0U2VudGluZWxDc2FyRGh1cyIsICAgICAgImRpZCI6IlNlbnRpbmVsMUEvQ1NBUi9JVyIsICAgICAgImdpZCI6IlMxQV9JV19HUkRIXzFTRFZfMjAyMTA2MTlUMTg0MjMxXzIwMjEwNjE5VDE4NDI1Nl8wMzg0MTNfMDQ4ODY5Xzc3MkIiICAgfSwgICB7ICAgICAgImdpZCI6IlMxQV9JV19HUkRIXzFTRFZfMjAyMTA3MDFUMTg0MjMyXzIwMjEwNzAxVDE4NDI1N18wMzg1ODhfMDQ4REE0XzMwQUQiICAgfV0mU1RZTEU9aWYoaWYobHZsKGRpZihwb2x5KHNhcmYocHAoczFjYWwoczFuYyhiYW5kKDA6UVRfdnYpKSxiMCwwKSksMDpyYXN0ZXJDcnNPcnRobyxjZGVtMzAsZWdtMjAwOCwxLDApLC00Mi43Nzc4LC0xLjQ1MzcpLHNhcmYocHAoczFjYWwoczFuYyhiYW5kKDA6UVRfdmgpKSxiMCwwKSksMDpyYXN0ZXJDcnNPcnRobyxjZGVtMzAsZWdtMjAwOCwxLDApKSxubiwxMyksZ3QsMCx1aW50KDI1NSksdWludCgxKSksZXEsMjU1LGlmKGlmKGx2bChkaWYocG9seShzYXJmKHBwKHMxY2FsKHMxbmMoYmFuZCgxOlFUX3Z2KSksYjAsMCkpLDE6cmFzdGVyQ3JzT3J0aG8sY2RlbTMwLGVnbTIwMDgsMSwwKSwtNDIuNzc3OCwtMS40NTM3KSxzYXJmKHBwKHMxY2FsKHMxbmMoYmFuZCgxOlFUX3ZoKSksYjAsMCkpLDE6cmFzdGVyQ3JzT3J0aG8sY2RlbTMwLGVnbTIwMDgsMSwwKSksbm4sMTMpLGd0LDAsdWludCgyNTUpLHVpbnQoMSkpLGVxLDI1NSx1aW50KDApLHVpbnQoMSkpLGlmKGlmKGx2bChkaWYocG9seShzYXJmKHBwKHMxY2FsKHMxbmMoYmFuZCgxOlFUX3Z2KSksYjAsMCkpLDE6cmFzdGVyQ3JzT3J0aG8sY2RlbTMwLGVnbTIwMDgsMSwwKSwtNDIuNzc3OCwtMS40NTM3KSxzYXJmKHBwKHMxY2FsKHMxbmMoYmFuZCgxOlFUX3ZoKSksYjAsMCkpLDE6cmFzdGVyQ3JzT3J0aG8sY2RlbTMwLGVnbTIwMDgsMSwwKSksbm4sMTMpLGd0LDAsdWludCgyNTUpLHVpbnQoMSkpLGVxLDI1NSx1aW50KDIpLHVpbnQoMykpKQ==?SERVICE=WCS&VERSION=2.0.1&REQUEST=GetCoverage&COVERAGEID=coverageId&SUBSET=Lat(4.7107890594482,4.7569230545044)&SUBSET=Long(-6.715434741211,-6.6330372802735)&FORMAT=image/tiffHere, we have changed 2 things in comparison with the previous request : GRANULES and STYLE :
First, we wanted to compare two dates in the POF-ML, so we used the GRANULES syntax wich allow us to define multiple products at once, and then adress them with their number (first to be added will be 0, second will be 1 and so on and so forth). With this syntax, we define the module and dataset identifier of the first product, and the next product will keep the configuration (so we dont have to put the same thing again and again) until we have another type of product.
[
    {"mid":"VtSentinelCsarDhus","did":"Sentinel1A/CSAR/IW","gid":"S1A_IW_GRDH_1SDV_20210619T184231_20210619T184256_038413_048869_772B"},
    {"gid":"S1A_IW_GRDH_1SDV_20210701T184232_20210701T184257_038588_048DA4_30AD"}
]
As we can see, we have 2 VtSentinelCsarDhus / Sentinel1A/CSAR/IW products, so its defined only one time.
Next, the POF-ML style. Once decoded in base64 gives:
STYLE=if(if(lvl(dif(poly(sarf(pp(s1cal(s1nc(band(0:QT_vv)),b0,0)),0:rasterCrsOrtho,cdem30,egm2008,1,0),-42.7778,-1.4537),sarf(pp(s1cal(s1nc(band(0:QT_vh)),b0,0)),0:rasterCrsOrtho,cdem30,egm2008,1,0)),nn,13),gt,0,uint(255),uint(1)),eq,255,if(if(lvl(dif(poly(sarf(pp(s1cal(s1nc(band(1:QT_vv)),b0,0)),1:rasterCrsOrtho,cdem30,egm2008,1,0),-42.7778,-1.4537),sarf(pp(s1cal(s1nc(band(1:QT_vh)),b0,0)),1:rasterCrsOrtho,cdem30,egm2008,1,0)),nn,13),gt,0,uint(255),uint(1)),eq,255,uint(0),uint(1)),if(if(lvl(dif(poly(sarf(pp(s1cal(s1nc(band(1:QT_vv)),b0,0)),1:rasterCrsOrtho,cdem30,egm2008,1,0),-42.7778,-1.4537),sarf(pp(s1cal(s1nc(band(1:QT_vh)),b0,0)),1:rasterCrsOrtho,cdem30,egm2008,1,0)),nn,13),gt,0,uint(255),uint(1)),eq,255,uint(2),uint(3)))This style seems hard to uderstand but its only a series of if and else defining whether or not the output will be flood, soil or water. If you want to learn more about the POF-ML syntax with examples and documentation, feel free to explore the POF-ML section.
Result of the request
The result of this request will be a tiff with the POF-ML style applied, all red areas are areas that were flooded on the first of july in 2021.