Services
Coverage API
The coverage API allow you to download geotiffs.
Thanks to the POF-ML, you can download your products calibrated and with specific styles to be able to perform annalysis, visualisation or more.
Feel free to use the jupyter notebook example to have a better understanding of what is possible with the Coverage API.
Downloading calibrated product (DB)
Construction of the request
Here is an example of request to download vv polarization of calibrated Sentinel-1A:
https://visioterra.org/VtWeb/servlet/GeotiffServlet?MODULEID=VtSentinelCsarDhus&DATASETID=Sentinel1A/CSAR/IW&GRANULEID=S1A_IW_GRDH_1SDV_20210619T184231_20210619T184256_038413_048869_772B&STYLE=sar(pp(s1cal(s1nc(band(QT_vv)),g0)),rasterCrsOrtho,cdem30,egm2008)&BBOX=-6.715434741211,4.7569230545044,-6.6330372802735,4.7107890594482&LEVEL=11It might be hard to understand at first, so let decompose the request :
First, we have the visioterra base url:
https://visioterra.orgSecond is the path to the Coverage API:
/VtWeb/servlet/GeotiffServlet?Last, we have 6 parameters to define :
- MODULEID : the module identifier defined by the product
- DATASETID : the dataset identifier defined by the product
- GRANULEID : the product identifier
- STYLE : a POF-ML style
- BBOX : the bounding box on which we want to work / that we want as a tiff
- LEVEL : the resolution that we want (13 ≈ 10 meters, 12 ≈ 20m, 11 ≈ 40m...). See the table here
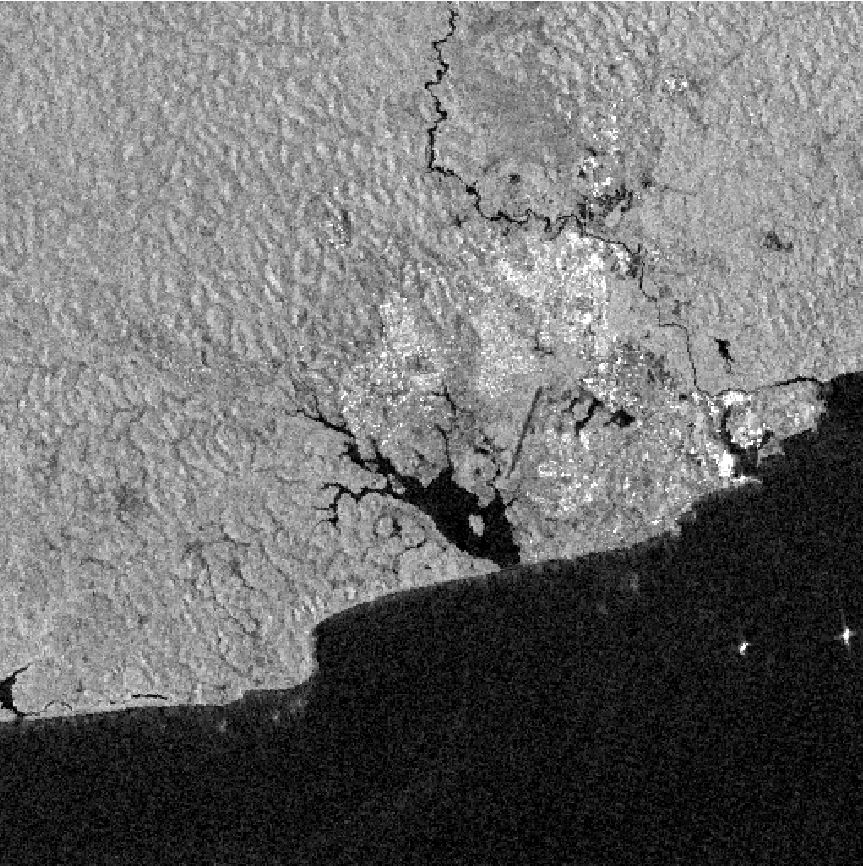
Result of the request
The result of this request will be a tiff with the calibration style applied
Downloading POF-ML stylised data
Construction of the request
Here is an example of request to download a flooding indicator. San pedro has suffered major floodings between 2021/06/19 and 2021/07/01. So let compare the two dates :
https://visioterra.org/VtWeb/servlet/GeotiffServlet?STYLE=if(if(lvl(dif(poly(sarf(pp(s1cal(s1nc(band(0:QT_vv)),b0,0)),0:rasterCrsOrtho,cdem30,egm2008,1,0),-42.7778,-1.4537),sarf(pp(s1cal(s1nc(band(0:QT_vh)),b0,0)),0:rasterCrsOrtho,cdem30,egm2008,1,0)),nn,13),gt,0,uint(255),uint(1)),eq,255,if(if(lvl(dif(poly(sarf(pp(s1cal(s1nc(band(1:QT_vv)),b0,0)),1:rasterCrsOrtho,cdem30,egm2008,1,0),-42.7778,-1.4537),sarf(pp(s1cal(s1nc(band(1:QT_vh)),b0,0)),1:rasterCrsOrtho,cdem30,egm2008,1,0)),nn,13),gt,0,uint(255),uint(1)),eq,255,uint(0),uint(1)),if(if(lvl(dif(poly(sarf(pp(s1cal(s1nc(band(1:QT_vv)),b0,0)),1:rasterCrsOrtho,cdem30,egm2008,1,0),-42.7778,-1.4537),sarf(pp(s1cal(s1nc(band(1:QT_vh)),b0,0)),1:rasterCrsOrtho,cdem30,egm2008,1,0)),nn,13),gt,0,uint(255),uint(1)),eq,255,uint(2),uint(3)))&BBOX=-6.715434741211,4.7569230545044,-6.6330372802735,4.7107890594482&LEVEL=11&GRANULES=[{"mid":"VtSentinelCsarDhus","did":"Sentinel1A/CSAR/IW","gid":"S1A_IW_GRDH_1SDV_20210619T184231_20210619T184256_038413_048869_772B"},{"gid":"S1A_IW_GRDH_1SDV_20210701T184232_20210701T184257_038588_048DA4_30AD"}]Here, we have changed 2 things in comparison with the previous request : GRANULES and STYLE :
First, we wanted to compare two dates in the POF-ML, so we used the GRANULES syntax wich allow us to define multiple products at once, and then adress them with their number (first to be added will be 0, second will be 1 and so on and so forth). With this syntax, we define the module and dataset identifier of the first product, and the next product will keep the configuration (so we dont have to put the same thing again and again) until we have another type of product.
[
    {"mid":"VtSentinelCsarDhus","did":"Sentinel1A/CSAR/IW","gid":"S1A_IW_GRDH_1SDV_20210619T184231_20210619T184256_038413_048869_772B"},
    {"gid":"S1A_IW_GRDH_1SDV_20210701T184232_20210701T184257_038588_048DA4_30AD"}
]
As we can see, we have 2 VtSentinelCsarDhus / Sentinel1A/CSAR/IW products, so its defined only one time.
Next, the POF-ML style :
STYLE=if(if(lvl(dif(poly(sarf(pp(s1cal(s1nc(band(0:QT_vv)),b0,0)),0:rasterCrsOrtho,cdem30,egm2008,1,0),-42.7778,-1.4537),sarf(pp(s1cal(s1nc(band(0:QT_vh)),b0,0)),0:rasterCrsOrtho,cdem30,egm2008,1,0)),nn,13),gt,0,uint(255),uint(1)),eq,255,if(if(lvl(dif(poly(sarf(pp(s1cal(s1nc(band(1:QT_vv)),b0,0)),1:rasterCrsOrtho,cdem30,egm2008,1,0),-42.7778,-1.4537),sarf(pp(s1cal(s1nc(band(1:QT_vh)),b0,0)),1:rasterCrsOrtho,cdem30,egm2008,1,0)),nn,13),gt,0,uint(255),uint(1)),eq,255,uint(0),uint(1)),if(if(lvl(dif(poly(sarf(pp(s1cal(s1nc(band(1:QT_vv)),b0,0)),1:rasterCrsOrtho,cdem30,egm2008,1,0),-42.7778,-1.4537),sarf(pp(s1cal(s1nc(band(1:QT_vh)),b0,0)),1:rasterCrsOrtho,cdem30,egm2008,1,0)),nn,13),gt,0,uint(255),uint(1)),eq,255,uint(2),uint(3)))This style seems hard to uderstand but its only a series of if and else defining whether or not the output will be flood, soil or water. If you want to learn more about the POF-ML syntax with examples and documentation, feel free to explore the POF-ML section.
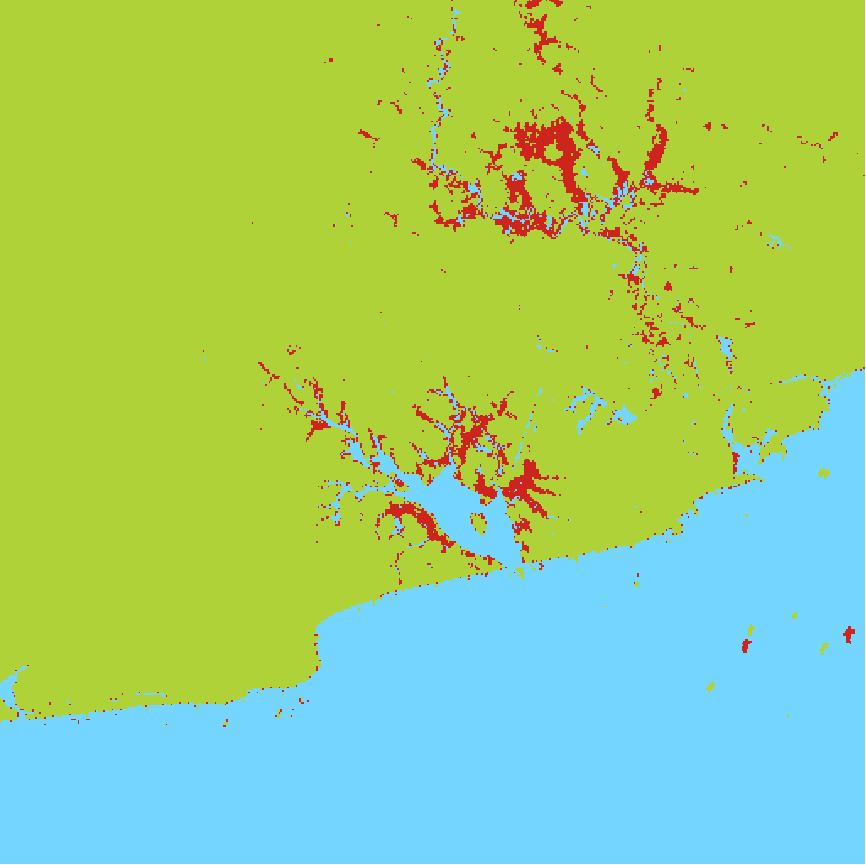
Result of the request
The result of this request will be a tiff with the POF-ML style applied, all red areas are areas that were flooded on the first of july in 2021.