Services
Analysis API
The Analysis API allows retrieving statistics like mean, standard deviation, minimum, maximum or even histogram about a user defined POF-ML script within an area of interest. Using this API, one may compute statistics of any value like the NDVI, backscattering coefficient, temperature, precipitation, elevation and so on, on a user defined area. Learn more about this API with this notebook
Syntax
To perform a request on the analysis API, one may specified at least the POF-ML script and the polygon in which the statistics will be computed.
Simple statistics request
For a simple statistics request, the API syntax is the following:
https://somedomain/path/to/api?moduleId=module1&datasetId=dataset1&granuleId=granule1&style=pofmlwhere
- moduleId / datasetId / granuleId - is the product identification. See the Product definition section of POF-ML syntax.
- style - is the POF-ML script. See the POF-ML Script section of POF-ML syntax.
The polygon is given using the GeoJSON format in the body of the request.
{
    "type" : "Polygon",
    "coordinates": [[
        [lon1,lat1],[lon2,lat2],[lon3,lat3],[lon4,lat4],[lon1,lat1]
    ]]
}
The return is a JSON object as follow
{
    "minimum" : 8.908344268798828,
    "average" : 42.97615590496598,
    "stddev" : 36.76241506206621,
    "maximum" : 235.10011291503906,
    "pixelCount" : 535,
    "backgroundCount" : 65001
}
Histogram request
The histogram request allows the retrieving of a quantile. The quantile are defined by the user with additional parameters.
https://somedomain/path/to/api?moduleId=module1&datasetId=dataset1&granuleId=granule1&style=pofml&histoMin=0&histoMax=220&binCount=11where
- histoMin - is the first quantile of the histogram.
- histoMax - is the last quantile of the histogram.
- binCount - is the number of quantile in the histogram.
The return is a JSON object as follow
{
    "minimum":8.908344268798828,
    "average":42.97615590496598,
    "stddev":36.76241506206621,
    "maximum":235.10011291503906,
    "pixelCount":535,
    "backgroundCount":65001,
    "histoMin":0,
    "histoMax":220,
    "histogram":[
        [0,   129,    "[0.0,20.0["],
        [20,  214,   "[20.0,40.0["],
        [40,  107,   "[40.0,60.0["],
        [60,   27,   "[60.0,80.0["],
        [80,   14,  "[80.0,100.0["],
        [100,  15, "[100.0,120.0["],
        [120,  10, "[120.0,140.0["],
        [140,   5, "[140.0,160.0["],
        [160,   5, "[160.0,180.0["],
        [180,   4, "[180.0,200.0["],
        [200,   2, "[200.0,220.0["]
    ]
}
There is three new values in the returned JSON:
- histoMin and histoMax - which are a reminder of the specified min/max.
- histogram - which the computed histogram within the given polygon. It is composed of an array of quantile. Each quantile is an array containing:
- the start of the quantile;
- the pixel count for this quantile;
- a generated label for this quantile.
Examples
Simple statistics request
Here after is an example of an analysis API request.
https://visioterra.org/VtWeb/servlet/consumer/stats?ModuleId=VtSentinelMsi&DatasetId=Sentinel2B/MSI&GranuleId=S2B_MSIL1C_20210315T102709_N0209_R108_T30RYS_20210315T130314&style=ndvi(QT_B08,QT_B04)with the body
{
    "type":"Polygon",
    "coordinates":[[
        [-0.1143668494239,28.250536082215],[-0.11385909540014,28.25050069598],[-0.11336384495057,28.250395408669],[-0.11289329367356,28.250222813001],[-0.11245902880866,28.249987159162],[-0.11207174385099,28.24969425012],[-0.111740975213,28.249351298686],[-0.11147486734648,28.248966749907],[-0.11127997220705,28.248550073051],[-0.11116108813526,28.24811152836],[-0.11112114153054,28.247661914471],[-0.11116111502584,28.247212302439],[-0.11128002335598,28.246773763134],[-0.11147493774687,28.246357094669],[-0.11174105797374,28.245972556462],[-0.11207183087073,28.245629616747],[-0.11245911156935,28.245336719424],[-0.11289336407402,28.245101076157],[-0.11336389609949,28.24492848888],[-0.11385912229072,28.244823206955],[-0.1143668494239,28.244787822576],[-0.11487457655708,28.244823206955],[-0.11536980274832,28.24492848888],[-0.11584033477379,28.245101076157],[-0.11627458727846,28.245336719424],[-0.11666186797707,28.245629616747],[-0.11699264087406,28.245972556462],[-0.11725876110094,28.246357094669],[-0.11745367549183,28.246773763134],[-0.11757258382197,28.247212302439],[-0.11761255731726,28.247661914471],[-0.11757261071255,28.24811152836],[-0.11745372664075,28.248550073051],[-0.11725883150133,28.248966749907],[-0.1169927236348,28.249351298686],[-0.11666195499682,28.24969425012],[-0.11627467003915,28.249987159162],[-0.11584040517424,28.250222813001],[-0.11536985389724,28.250395408669],[-0.11487460344766,28.25050069598],[-0.1143668494239,28.250536082215]
    ]]
}
Lets decompose the URL for a better understanding.
First, we have the path to the analysis API.
https://visioterra.org/VtWeb/servlet/consumer/stats?Second is the product identification as defined in the POF-ML section.
ModuleId : VtSentinelMsi
DatasetId: Sentinel2B/MSI
GranuleId: S2B_MSIL1C_20210315T102709_N0209_R108_T30RYS_20210315T130314
Finaly we have the POF-ML style which compute the NDVI using the Sentinel-2 B08 and B04.
ndvi(QT_B08,QT_B04)The body part define a polygon using the GeoJSON format. This polygon correspond to a circular crop field in Algeria.
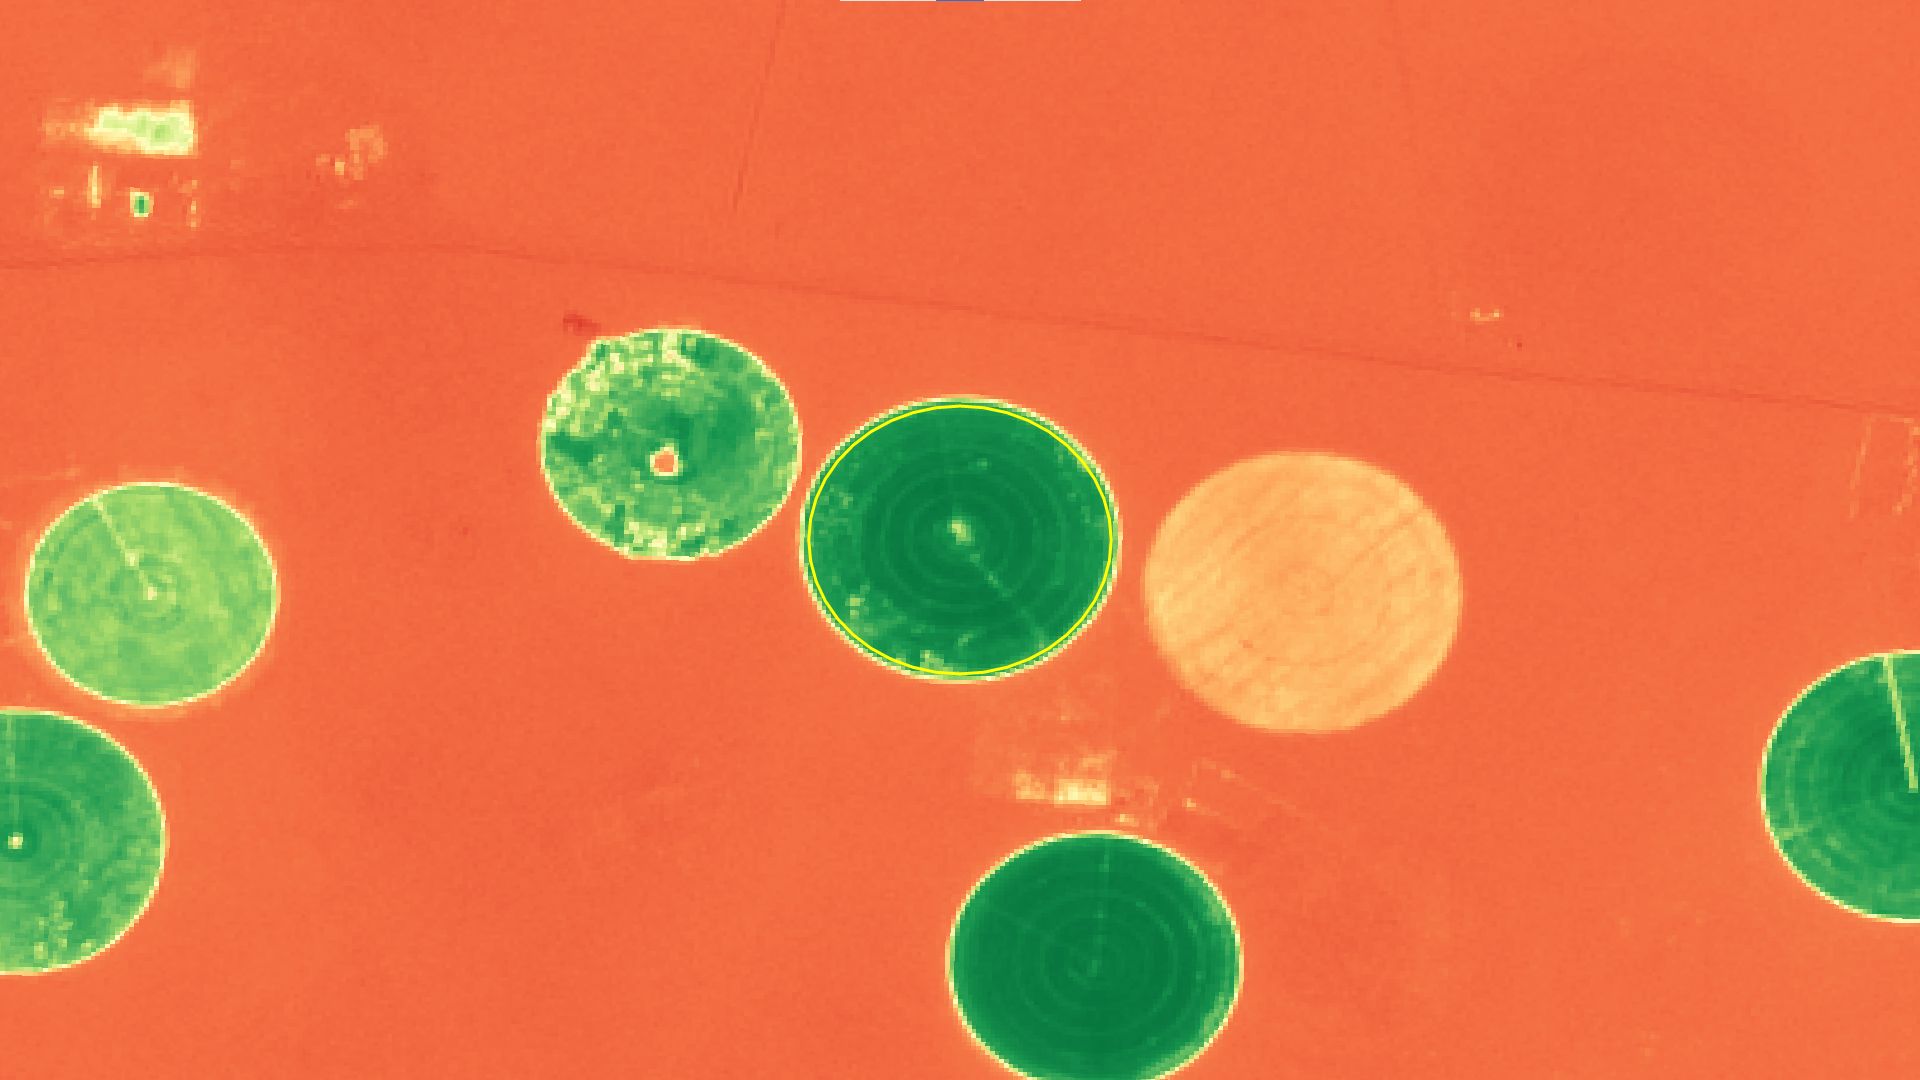
The return of this request is the following JSON. The mean NDVI value for this acquisition is around 0.73.
{
    "minimum" : 0.1216028556227684,
    "average" : 0.7345219080553467,
    "stddev" : 0.10403377588325417,
    "maximum" : 0.7992172837257385,
    "pixelCount" : 266,
    "backgroundCount" : 65270
}
Histogram request
Additionally, one may request the histogram of value by adding some parameters to the request.
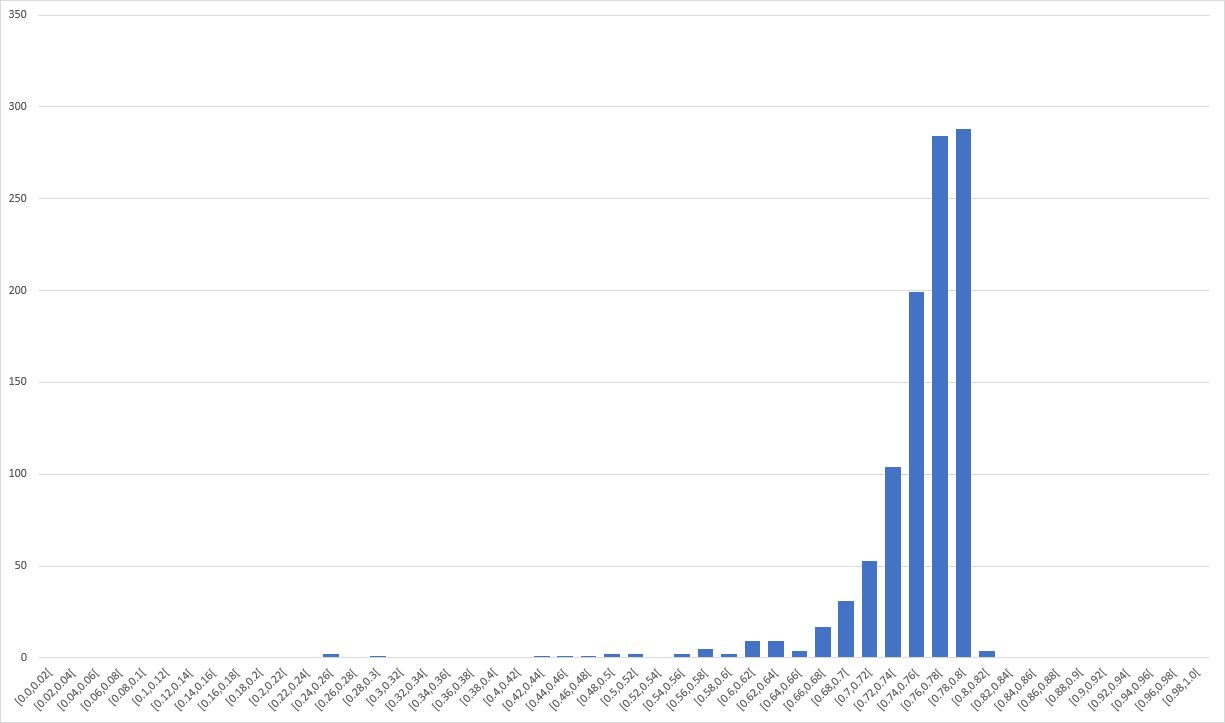
https://visioterra.org/VtWeb/servlet/consumer/stats?ModuleId=VtSentinelMsi&DatasetId=Sentinel2B/MSI&GranuleId=S2B_MSIL1C_20210315T102709_N0209_R108_T30RYS_20210315T130314&style=for(if(*:QT_BCM,eq,1,ndvi(*:QT_B08,*:QT_B04)),over)&histoMin=0&histoMax=1&binCount=100The return of this request is a similar JSON with additional value.
{
    "minimum":0.2545807957649231,
    "average":0.7525123003414165,
    "stddev":0.05185827679681206,
    "maximum":0.8020066618919373,
    "pixelCount":1021,
    "backgroundCount":64515,
    "histoMin":0,
    "histoMax":1,
    "histogram":[
        [0,0,"[0.0,0.01["],
        [0.01,0,"[0.01,0.02["],
        [0.02,0,"[0.02,0.03["],
        ...
        [0.70,21,"[0.7,0.71["],
        [0.71,32,"[0.71,0.72["],
        [0.72,44,"[0.72,0.73["],
        ...
        [0.97,0.98["],
        [0.98,0,"[0.98,0.99["],
        [0.99,0,"[0.99,1.0["]
    ]
}
By plotting the "histogram" value, one may obtain the following chart: